
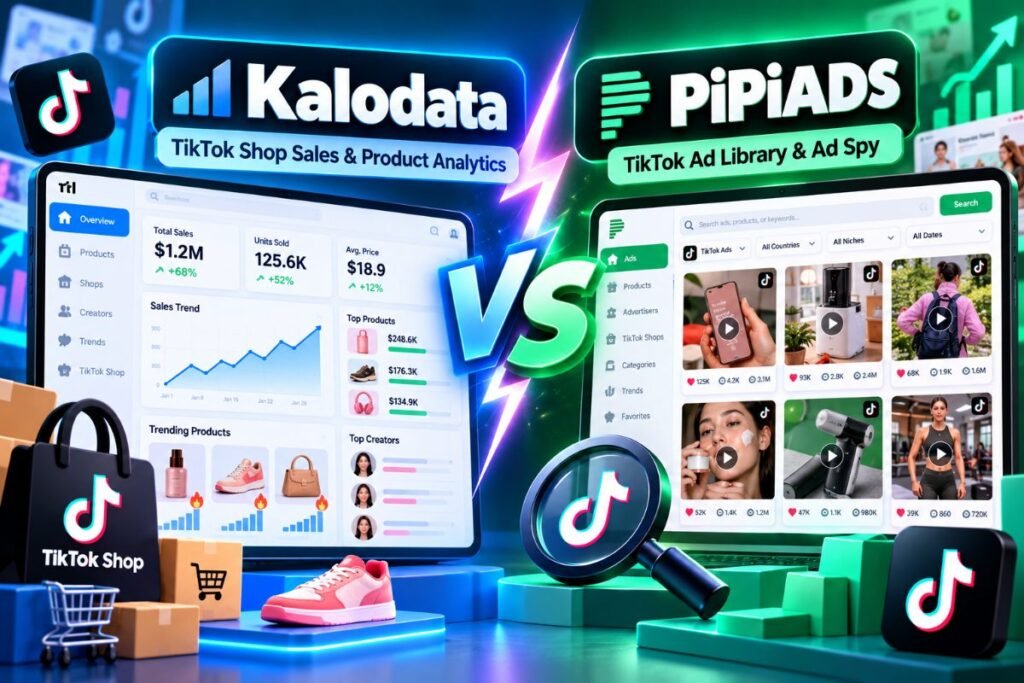
Choosing between Kalodata and PiPiADS can be confusing when you need a tool for TikTok Shop research. Both platforms help sellers find winning products and analyze ads, but they take different approaches. PiPiADS focuses heavily on ad spy features and creative analysis, while Kalodata puts more emphasis on TikTok Shop data and product tracking. Understanding these differences will save you money and help you pick the right tool for your business.
Quick tip: if you pick Kalodata, use code KDATAPROMO at checkout to save. Get the Kalodata deal, or see all Kalodata promo codes, the full Kalodata pricing and the free trial.
| Kalodata | PiPiADS | |
|---|---|---|
| Best for | TikTok Shop product and creator research | TikTok ad spy and creative research |
| Main data | Shop sales, products, creators | TikTok ads and creatives |
| Starting price | $45.90/mo ($38.30/mo yearly) | See official site |
| Deal | Code KDATAPROMO | – |

Each one has strengths depending on whether you care more about finding viral products or studying competitor ad campaigns. The pricing structures are also quite different, which matters when you’re trying to stay within budget.
In this comparison, I’ll break down what each platform does best. You’ll learn which features matter most for your workflow and how to decide between these TikTok Shop tools. By the end, you’ll know exactly which one fits your needs.
Key Takeaways
- PiPiADS excels at ad spying and creative analysis while Kalodata focuses more on TikTok Shop product data
- Both tools offer product research features but with different filtering options and data depth
- Your choice depends on whether you prioritize ad insights or shop performance tracking for your business
Quick Verdict by Primary Use Case
PiPiADS works best for ad intelligence and creative research, while Kalodata excels at TikTok Shop analytics and sales data. Your choice depends on whether you need ad spy features or product performance metrics.
Choose PiPiADS for Paid Ad and Creative Research
You recommend PiPiADS if your main goal is studying TikTok and Facebook ads. The platform helps you find active ads, review creative hooks, and monitor what other advertisers are doing.
Dropshippers and creative teams get the most value from PiPiADS. You can collect ad examples, track which creatives are running longest, and see what messaging works. The tool focuses on the advertising side rather than sales data.
Best for:
- Finding winning ad creatives
- Monitoring competitor ad campaigns
- Building swipe files of successful hooks
- Tracking ad performance across platforms
PiPiADS gives you the raw materials to improve your paid campaigns. If you spend money on TikTok or Facebook ads, this tool helps you learn from what’s already working in your niche.
Choose Kalodata for TikTok Shop Sales Intelligence
Kalodata is your pick when TikTok Shop sales research is your priority. The platform shows you actual sales numbers, trending products, and which items are gaining traction on TikTok Shop.
TikTok Shop sellers need different data than traditional dropshippers. You want to know which products are selling, what price points work, and which affiliates drive the most revenue. Kalodata provides these e-commerce strategies through its analytics dashboard.
Key features:
- Real sales volume data
- Product trend tracking
- Affiliate performance metrics
- Revenue estimates for TikTok Shop items
You find Kalodata more useful if you’re selling directly on TikTok Shop or choosing products based on platform-specific performance. The sales intelligence helps you make smarter inventory decisions.
When Using Both Tools Makes Sense
Some businesses benefit from running both platforms together. You’ve seen agencies and larger brands use PiPiADS for creative research while using Kalodata to validate product choices.
If you have budget for both, use Kalodata to find trending products with strong sales data. Then use PiPiADS to research how competitors advertise similar items. This combo covers product selection and ad creative development.
Smaller sellers should pick one tool based on their biggest weakness. Focus on Kalodata if you struggle finding winning products. Choose PiPiADS if you have products but your ads don’t convert.
Core Focus and Data Coverage
PiPiADS centers on advertising intelligence across multiple platforms, while Kalodata specializes in TikTok Shop commerce metrics. The platforms differ significantly in what data they collect, how far back their records go, and which markets they support.
PiPiADS Ad Database and Cross-Platform Coverage
PiPiADS maintains an ad library with over 50 million advertisements from TikTok and Facebook. This cross-platform approach helps you study how advertisers test creatives across different channels.
The ad spy tool focuses on paid traffic rather than organic content. You can filter TikTok ads by engagement, duration, call-to-action buttons, landing pages, and e-commerce platforms.
The advertiser tracking feature lets you monitor specific competitors over time. When you follow an advertiser, you see when they launch new campaigns, which products they promote, and how long their ads stay active.
PiPiADS covers advertising markets globally. This includes countries where TikTok Shop doesn’t operate yet, making it useful for standard e-commerce and dropshipping outside TikTok’s native commerce features.
Kalodata TikTok Shop Data and Commerce Coverage
Kalodata collects data specifically from TikTok Shop transactions and activities. The platform tracks products, shops, creators, videos, live streams, and estimated GMV across supported markets.
You can access estimated sales figures, product rankings, and revenue trends. This TikTok Shop data connects products to the creators promoting them, the videos driving traffic, and the shops selling them.
Kalodata supports major TikTok Shop markets including the United States, United Kingdom, Germany, France, Spain, Italy, Mexico, Brazil, Indonesia, Malaysia, Thailand, Vietnam, the Philippines, Singapore, and Japan. The platform doesn’t cover countries where TikTok Shop isn’t active.
The tool processes public TikTok Shop information through its own models. Kalodata warns that transaction estimates may differ from actual numbers, so you should use the data for research rather than exact calculations.
Data Availability, Market Coverage, and Historical Views
Kalodata advertises historical data spanning up to 1,000 days. This lets you review product performance trends, seasonal patterns, and long-term shop growth.
PiPiADS historical data depends on your selected plan and the ad database coverage. The platform tracks ads from when they first appear in its system until they stop running.
Market coverage differs by purpose:
- PiPiADS covers global advertising markets for both TikTok ads and Facebook ads
- Kalodata covers specific countries where it supports TikTok Shop commerce tracking
You can’t directly compare country counts because PiPiADS tracks advertising availability while Kalodata tracks commerce infrastructure. A country might have TikTok ads without having TikTok Shop, or vice versa.
Product, Shop, and Competitor Research
PiPiADS focuses on finding products through active advertisements, while Kalodata provides direct access to TikTok Shop sales data, product rankings, and shop-level performance metrics.
Ad-Led Product Discovery in PiPiADS
PiPiADS helps you find products by showing which items advertisers are actively promoting. You can filter ads by engagement, run duration, and country to spot products with sustained advertising campaigns.
The platform tracks ad-to-product mapping by connecting advertisements to their landing pages and product pages. When you see an ad running for multiple days or weeks, it suggests the advertiser finds value in continuing the campaign.
However, an actively advertised product doesn’t guarantee TikTok Shop success. You’re seeing paid traffic signals, not actual sales data. The product might perform well with paid ads but struggle with organic reach or affiliate sales.
PiPiADS works best when you need to understand how competitors present products through paid creative. You can study their hooks, offers, and product demonstrations. This comparison of PiPiADS and Kalodata shows that PiPiADS is stronger for advertising intelligence than TikTok Shop commerce research.
Product Rankings and Category Trends in Kalodata
Kalodata gives you access to trending products based on actual TikTok Shop performance data. You can view estimated sales, GMV, and product rankings within specific categories.
The platform shows you:
- Product sales movement over recent days
- Category performance and emerging trends
- Price points for successful products
- Related creators promoting each product
- Shoppable videos driving sales
- Live stream activity and recordings
Kalodata tracks product trends across multiple TikTok Shop markets. You can research products in the United States, United Kingdom, Germany, France, Spain, and several Asian markets.
The platform advertises historical data for up to 1,000 days. This helps you identify seasonal patterns and product lifecycle trends. Kalodata warns that its transaction estimates may differ from actual figures, so you use the data for research rather than precise calculations.
Competitor Shop Analysis and Validation Signals
Kalodata provides detailed competitor shop analysis at the account level. You can study a competing shop’s estimated GMV, top-performing products, product portfolio, creator partnerships, and sales sources.
This helps you understand the competitor’s TikTok Shop strategy beyond individual products. You see which categories they focus on, their price range, and whether they rely more on organic content or paid traffic.
PiPiADS approaches competitor research differently. It shows you which ads a competitor is running, how frequently they launch new creatives, and which products appear in their advertising. You can track advertiser activity and build a file of their creative approaches.
For complete competitor analysis, you need different tools for different questions. PiPiADS answers “What ads are they running?” while Kalodata answers “How is their TikTok Shop performing?”
Creative, Ads, and Influencer Insights

PiPiADS focuses on advertising intelligence and creative inspiration, while Kalodata emphasizes TikTok Shop commerce data with creator and video performance tied to sales.
Ad Creative Research, Hooks, and Creative Inspiration
PiPiADS works better for ad creative research. The platform helps you find TikTok and Facebook ads using advanced filters like country, engagement, ad duration, and call-to-action buttons.
You can study how advertisers present products by looking at their hooks, offers, and landing pages. PiPiADS specializes in TikTok ad research and lets you track which ads stay active for long periods. A long-running ad might signal that the advertiser finds it valuable.
The platform includes over 50 million ads in its database. You can filter by e-commerce platform, ad format, impressions, likes, comments, and shares to narrow down results.
Kalodata offers some video and advertising analysis, but it’s not the main focus. The platform can help you tell the difference between organic and paid traffic. However, Kalodata connects ads to TikTok Shop products and sales data rather than focusing purely on creative inspiration.
Creator Discovery and Influencer Performance Analysis
Kalodata wins for creator discovery and influencer analytics. You can find creators based on their product promotion history and estimated sales performance.
The platform shows you which creators promote specific products, their audience information, and their shoppable videos. You can also see live-stream activity and recent growth metrics. This helps you choose affiliates based on actual sales signals instead of just follower counts.
Key creator metrics in Kalodata:
- Product promotion history
- Estimated sales performance
- Related shops and products
- Live-stream activity
- Category focus
PiPiADS might show you creators who appear in successful ads. But it doesn’t provide detailed influencer performance data or sales-focused creator analytics. The platform focuses on advertising rather than influencer analysis for TikTok Shop partnerships.
Short Videos and Livestream Intelligence
Kalodata provides better tools for analyzing short video trends and livestream metrics. You can research shoppable videos to see which content drives product sales.
The platform includes livestream recording and per-minute analysis. You can watch how hosts demonstrate products, answer questions, and build trust with viewers. This matters for products that need longer explanations or live demonstrations.
Kalodata tracks audience activity and sales changes during live streams. You can see which products get featured and how traffic shifts minute by minute.
PiPiADS doesn’t focus on live commerce or organic video performance. The tool centers on paid advertising creatives rather than the full video and livestream environment where TikTok Shop sales happen.
Features, Performance, and Pricing Factors

PiPiADS centers on ad intelligence while Kalodata prioritizes TikTok Shop analytics. The tools deliver different datasets, filters, and pricing structures based on whether you need creative research or commerce metrics.
Filters, Search Workflows, and Exports
PiPiADS offers advanced filters built for ad discovery. You can search by country, language, engagement, ad format, call-to-action button, and landing page type.
The ad database includes impressions, likes, comments, shares, and run duration. This helps you identify which creatives remain active over time.
Kalodata filters focus on TikTok Shop product research. You can sort by estimated GMV, sales trends, category, price range, and creator activity. The platform lets you research shops, videos, live streams, and product rankings.
Both tools support exports. PiPiADS uses a credit system that consumes credits when you view detailed ad data or download creatives. Kalodata includes product and creator exports on paid plans with usage limits based on the subscription tier.
Data Refreshes, Metrics, and Research Limits
PiPiADS tracks advertising activity across TikTok and Facebook. The platform claims coverage of over 50 million ads across multiple countries.
Historical data availability depends on your selected plan and the ad database. Longer-running ads may signal advertiser confidence, but you cannot see actual profitability or margins.
Kalodata advertises up to 1,000 days of historical data for supported TikTok Shop markets. The platform covers the United States, United Kingdom, Germany, France, Spain, Italy, Mexico, Brazil, Indonesia, Malaysia, Thailand, Vietnam, Philippines, Singapore, and Japan.
Kalodata warns that transaction and advertising estimates may differ from actual figures. you should use the data for research rather than formal performance evaluation.
Trials, Plans, and Total Tool Costs
PiPiADS pricing starts at $49 per month for the Basic plan during promotions. The Advanced plan lists at $99 per month promotional pricing. Enterprise plans reach $900 per month.
All plans use credits. Opening detailed advertiser data or using certain functions consumes your credit balance.
Kalodata offers a seven-day free trial without requiring a credit card. Paid plan prices appear on the official site with varying limits for product searches, creator searches, exports, and followed shops.
You need to compare included credits, detail view costs, user seats, and export limits rather than just monthly prices when evaluating which TikTok tool is better for your workflow.
How to Select the Right Platform for Your Workflow
Your choice between PiPiADS and Kalodata depends on whether you spend more time studying ads or analyzing TikTok Shop commerce data. The platform that fits your daily tasks will save you money and deliver better results than choosing based on price alone.
Best Fit for Advertisers and Creative Teams
You recommend PiPiADS if your main work involves studying TikTok and Facebook ads or building creative swipe files. The platform helps you find active advertisements, track how long ads run, and monitor what competitors are testing.
PiPiADS works well for dropshipping teams that need to discover products through paid traffic signals. You can filter by engagement, landing page, call-to-action, and ad format to find what advertisers are promoting.
Creative teams benefit from PiPiADS when they need to study hooks, scripts, and offer structures. The tool lets you save ad references and build creative test plans based on what’s already running in the market.
Media buyers can use PiPiADS to research competitor advertising activity across multiple countries. This makes it useful for agencies managing paid campaigns outside TikTok Shop markets where tools like Kalodata and FastMoss don’t provide coverage.
Best Fit for TikTok Shop Sellers and Affiliates
You recommend Kalodata if you need to research TikTok Shop products, shops, creators, or live streams. The platform focuses on TikTok Shop commerce data rather than advertising creative.
TikTok Shop sellers can use Kalodata to check estimated sales, product rankings, category trends, and competitor shop performance. This helps you validate products before adding them to your catalog.
Affiliates benefit from Kalodata’s creator analytics. You can find creators by product history, estimated sales performance, and related shops. This makes outreach lists more targeted than choosing creators from ad appearances alone.
The platform also supports live-stream monitoring and video research. You can study shoppable videos, track which products appear in live streams, and analyze sales sources. These features matter more for TikTok Shop strategies than for general e-commerce strategies focused on paid traffic.
A Practical Evaluation Checklist Before Subscribing
Check what data access you actually need:
- Do you need ad creative examples or product sales estimates?
- Are you researching advertisers or TikTok Shop competitors?
- Do you work across multiple platforms or only TikTok Shop?
Compare plan limits before choosing:
- How many credits or searches does the plan include?
- What’s the cost per detail view or export?
- Does the plan cover your target countries?
Test the workflow during trial periods. Both platforms offer trials, so I suggest testing your actual research process. Try finding a product, exporting data, or building a competitor report.
Consider combining tools for complete competitor analysis. Some teams use PiPiADS for creative research and Kalodata for TikTok Shop product research. This costs more but covers both paid and organic TikTok Shop tools workflows.
Frequently Asked Questions
Both tools serve different purposes in TikTok research. PiPiADS focuses on advertising intelligence while Kalodata specializes in TikTok Shop analytics and sales data.
Which tool is better for TikTok product research and ad spying?
You recommend PiPiADS if your main goal is studying TikTok and Facebook ads. It helps you find active advertisements, track how long ads run, and save creative examples for your swipe file.
The platform lets you filter ads by country, engagement, call-to-action buttons, and landing pages. This makes it useful when you want to see how advertisers present products through paid campaigns.
Kalodata works better for TikTok Shop product research. It shows estimated sales, product rankings, and which creators promote specific items.
You can study a product’s performance inside TikTok Shop rather than just seeing which products appear in ads. PiPiADS wins for creative research while Kalodata wins for TikTok Shop sales intelligence.
What are the main differences in features, pricing, and data accuracy?
PiPiADS uses a credit-based pricing system. The Basic plan starts at $49 per month during promotions, while the Advanced plan costs $99 per month.
Each plan includes different credit amounts. Opening detailed data or tracking advertisers uses credits from your account.
Kalodata offers a subscription with feature limits instead of credits. The platform covers TikTok Shop markets including the United States, United Kingdom, Germany, France, and several Asian countries.
PiPiADS claims over 50 million ads in its database across many advertising markets. Kalodata says it provides up to 1,000 days of historical TikTok Shop data.
Both platforms warn that their estimates may differ from actual results. I always use third-party data for research direction rather than exact performance numbers.
Is there a free trial or free plan available for either platform?
Kalodata advertises a seven-day free trial that does not require a credit card. This lets you test the platform’s product research, creator discovery, and shop analysis features before paying.
PiPiADS offers trial credits for new users instead of a time-based trial. You can explore the ad database and test basic features using these credits.
Neither platform offers a permanent free plan. You need a paid subscription to access full features and regular data updates.
I suggest testing the free options to see which workflow fits your needs better. The trial periods give you enough time to evaluate the interface and data quality.
Which platform is more reliable for finding winning TikTok products?
Neither tool guarantees you will find winning products. Both provide data signals that require your own analysis and testing.
PiPiADS shows which products appear in active advertisements. A long-running ad suggests the advertiser sees value in continuing it, but you cannot see their actual profit margins or customer lifetime value.
Kalodata provides estimated sales and GMV for TikTok Shop products. These estimates come from public data and the platform’s own models.
You use both types of data as starting points. An advertised product with strong TikTok Shop sales gives you more confidence than just one signal alone.
Product validation requires checking demand, competition, margins, shipping costs, and your ability to source or create the item. Research tools help with discovery but not with guaranteed success.
What do users on Reddit say about these TikTok research tools?
Limited recent Reddit discussions specifically comparing these two platforms. Most Reddit conversations about TikTok research tools focus on broader topics like dropshipping success and product validation methods.
Users typically emphasize that tools only provide data. Your success depends on how you use that information and execute your strategy.
Some sellers mention using multiple tools together. They might use PiPiADS for creative inspiration and Kalodata for sales data verification.
The general consensus suggests that no single tool solves every research need. Different workflows require different data sources.
What are the best free alternatives for TikTok ad and product research?
You can research TikTok products manually by browsing the TikTok Shop app and noting trending items. This takes more time but costs nothing.
The TikTok Creative Center offers free access to trending ads, hashtags, and songs. It does not provide the same filtering and tracking features as paid tools, but it helps you spot creative trends.
For basic ad spying, you can follow competitors and watch which products they promote repeatedly. Save their videos and study the hooks and offers they test.
Some sellers use TikTok’s native search to find products by category and sort by sales or reviews. This gives you basic market signals without paid subscriptions.
Free alternatives require more manual work but they can help you start researching before investing in premium tools. You recommend beginning with free methods to learn what data matters most for your business model.